
Solar uptake by region, ranked
“Share of homes” is the number of home electricity connections with solar, as a percentage of all home connections in the region. It lets you compare a small region with a big one. Regions are ranked on that share, highest first.
| Rank and region | Homes with solar | Share of homes | Share in Aug 2025 | Share in Aug 2021 |
|---|---|---|---|---|
| 1. Tasman | 2,202 | 9.4% | 7.9% | 3.6% |
| 2. Nelson | 1,721 | 7.8% | 6.6% | 2.9% |
| 3. Marlborough | 1,616 | 7.2% | 6.1% | 3.1% |
| 4. Northland | 5,789 | 7.0% | 6.1% | 3.1% |
| 5. Hawke’s Bay | 4,424 | 6.4% | 5.6% | 2.1% |
| 6. Bay of Plenty | 7,326 | 5.4% | 4.6% | 2.0% |
| 7. Canterbury | 14,661 | 5.1% | 4.2% | 1.9% |
| 8. Otago | 5,607 | 5.1% | 4.1% | 1.9% |
| 9. Taranaki | 2,532 | 5.0% | 3.8% | 1.5% |
| 10. Waikato | 8,997 | 4.3% | 3.7% | 1.8% |
| 11. Manawatū-Whanganui | 4,010 | 3.8% | 3.2% | 1.5% |
| 12. Gisborne | 604 | 3.6% | 3.4% | 2.0% |
| 13. Wellington | 7,718 | 3.6% | 3.0% | 1.4% |
| 14. Auckland | 15,586 | 2.5% | 2.3% | 1.3% |
| 15. Southland | 929 | 2.2% | 1.8% | 1.1% |
| 16. West Coast | 322 | 2.0% | 1.4% | 0.4% |
| New Zealand | 84,091 | 4.2% | 3.6% | 1.7% |

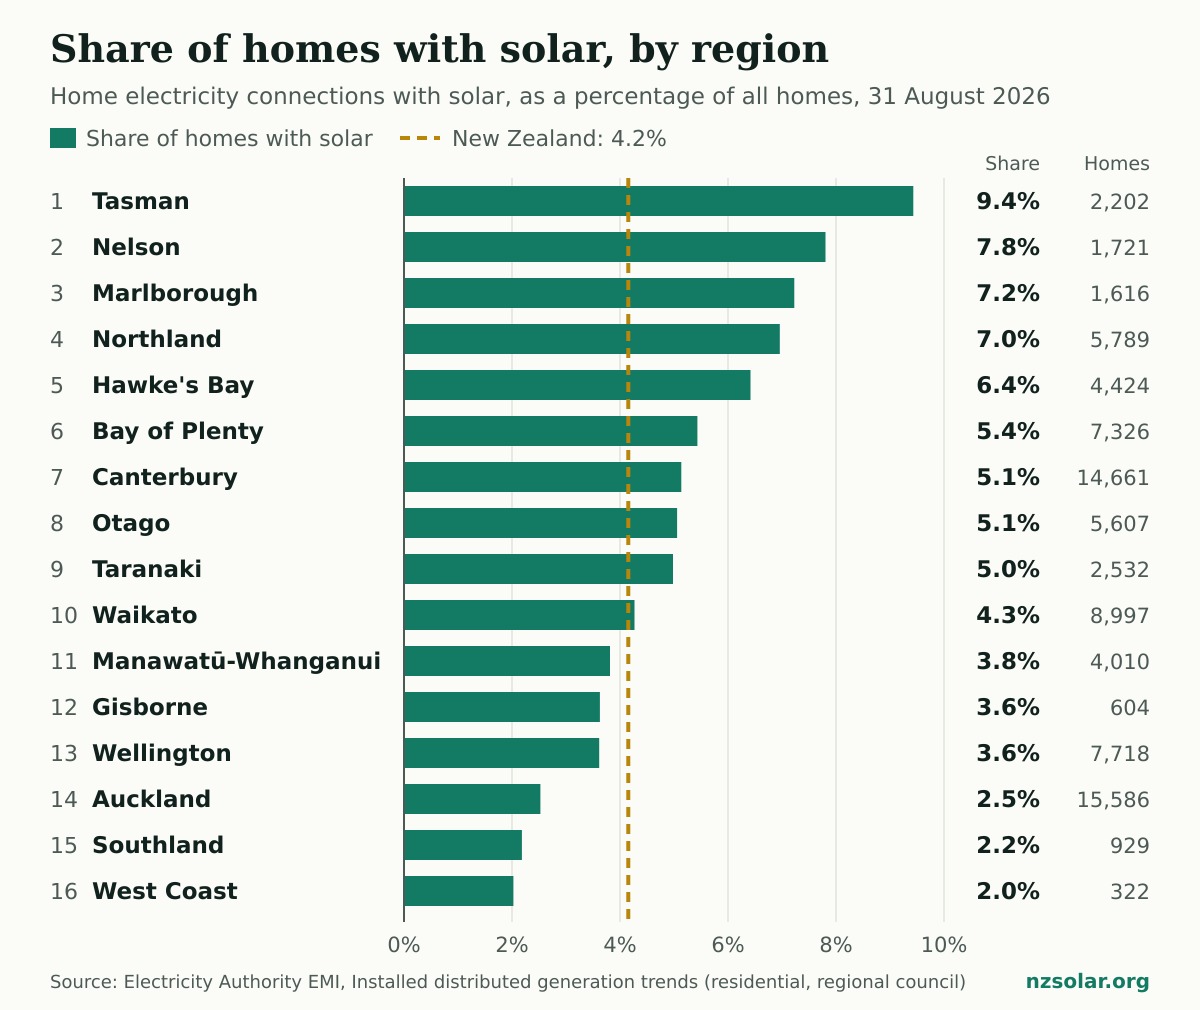
Three things stand out.
- The top of the South Island is well ahead. Tasman, Nelson and Marlborough are the only regions where more than 7% of homes have solar. Northland is just behind them.
- Ten of the 16 regions are above the national figure. The national 4.2% is pulled down by Auckland, which has about three in ten of the country’s homes and a share of only 2.5%.
- Most solar homes are in a few places. Auckland and Canterbury together have 30,247 solar homes, more than a third of the national total.
The figures show where solar is common. They do not say why. Sunshine, house types, power prices and how many people rent all differ between regions, and this data cannot separate them.
Solar uptake by local network area
Regions are large, and uptake varies inside them. The Electricity Authority also reports 38 smaller areas, each served by one lines company (the business that owns the poles and wires in your street). This table ranks all of them.
Central Otago has the highest share in the country: 12.4% of homes, about one in eight. Invercargill has the lowest, at 1.2%. Most of the big-city networks sit below the national figure, including Auckland (2.0%), Dunedin (2.0%) and Wellington (2.7%). Tauranga (6.3%) and Christchurch’s Central Canterbury network (4.7%) are the exceptions.
| Rank, area and lines company | Homes with solar | Share of homes | Share in Aug 2025 |
|---|---|---|---|
| 1. Central OtagoAurora Energy | 2,627 | 12.4% | 10.2% |
| 2. Nelson and Tasman1Network Tasman | 3,925 | 8.7% | 7.3% |
| 3. North CanterburyMainPower | 3,152 | 8.4% | 6.9% |
| 4. Bay of IslandsTop Energy | 2,437 | 8.3% | 7.5% |
| 5. QueenstownAurora Energy | 907 | 7.4% | 6.0% |
| 6. MarlboroughMarlborough Lines | 1,615 | 7.2% | 6.1% |
| 7. WairarapaPowerco | 1,655 | 7.1% | 6.0% |
| 8. Central Hawke’s BayCentralines | 479 | 7.1% | 6.2% |
| 9. Hawke’s BayUnison Networks | 3,841 | 6.7% | 5.9% |
| 10. WaipaWaipa Networks | 1,588 | 6.4% | 5.4% |
| 11. TaurangaPowerco | 5,220 | 6.3% | 5.2% |
| 12. Whangārei and KaiparaNorthpower | 3,325 | 6.2% | 5.4% |
| 13. Kāpiti and HorowhenuaElectra | 2,382 | 5.6% | 4.6% |
| 14. AshburtonEA Networks | 731 | 5.2% | 4.2% |
| 15. TaranakiPowerco | 2,502 | 5.0% | 3.8% |
| 16. Counties2Counties Power | 2,116 | 4.9% | 5.0% |
| 17. Eastern Bay of Plenty3Horizon Energy | 887 | 4.8% | n/a |
| 18. Central CanterburyOrion | 9,535 | 4.7% | 3.9% |
| 19. South CanterburyAlpine Energy | 1,160 | 4.2% | 3.5% |
| 20. WaikatoWEL Networks | 3,595 | 4.1% | 3.5% |
| 21. ManawatūPowerco | 2,002 | 4.0% | 3.3% |
| 22. WhanganuiPowerco | 1,131 | 3.9% | 3.3% |
| 23. Thames ValleyPowerco | 2,502 | 3.9% | 3.4% |
| 24. OtagoOtagoNet | 463 | 3.9% | 3.1% |
| 25. TaupōUnison Networks | 624 | 3.9% | 3.3% |
| 26. RotoruaUnison Networks | 1,066 | 3.7% | 3.3% |
| 27. WaitakiNetwork Waitaki | 379 | 3.6% | 3.1% |
| 28. Tairāwhiti and WairoaFirstlight Network | 699 | 3.2% | 3.1% |
| 29. WaitemataVector | 7,161 | 3.0% | 2.6% |
| 30. SouthlandThe Power Company | 773 | 2.8% | 2.3% |
| 31. WellingtonWellington Electricity | 4,384 | 2.7% | 2.3% |
| 32. West CoastWestpower | 255 | 2.2% | 1.4% |
| 33. DunedinAurora Energy | 1,034 | 2.0% | 1.7% |
| 34. AucklandVector | 6,891 | 2.0% | 1.9% |
| 35. King CountryThe Lines Company | 360 | 2.0% | 1.5% |
| 36. Southern Hawke’s BayScanpower | 94 | 1.9% | 1.7% |
| 37. BullerBuller Electricity | 68 | 1.6% | 1.3% |
| 38. InvercargillElectricity Invercargill | 190 | 1.2% | 1.1% |
1 Nelson Electricity merged into Network Tasman on 31 March 2026. The 2025 figure combines the two former areas. 2 The count for Counties fell slightly over the year and no new connections were recorded, so this figure is probably incomplete. 3 The total number of homes counted in Eastern Bay of Plenty fell by about 12% in the source data, so the two years cannot be compared.
Where solar is growing fastest
The number of solar homes in New Zealand grew 18% in the 12 months to August 2026 and is now 2.6 times what it was five years ago. Every region grew. The West Coast grew fastest, from a very low base: 108 more homes was a 50% rise. Canterbury added the most homes, 2,803, well ahead of Auckland’s 1,607.
| Region | Homes added, 12 months to Aug 2026 | Growth in 12 months | Compared with Aug 2021 |
|---|---|---|---|
| West Coast | 108 | +50% | 4.8 times |
| Taranaki | 591 | +30% | 3.4 times |
| Otago | 1,103 | +24% | 2.9 times |
| Canterbury | 2,803 | +24% | 3.0 times |
| Manawatū-Whanganui | 716 | +22% | 2.6 times |
| Southland | 164 | +21% | 2.0 times |
| Tasman | 374 | +20% | 2.8 times |
| Wellington | 1,274 | +20% | 2.8 times |
| Bay of Plenty | 1,200 | +20% | 2.8 times |
| Nelson | 275 | +19% | 2.8 times |
| Marlborough | 245 | +18% | 2.4 times |
| Waikato | 1,266 | +16% | 2.5 times |
| Northland | 730 | +14% | 2.4 times |
| Hawke’s Bay | 541 | +14% | 3.1 times |
| Auckland | 1,607 | +11% | 2.2 times |
| Gisborne | 41 | +7% | 1.9 times |
| New Zealand | 13,051 | +18% | 2.6 times |
Gisborne (+7%) and Auckland (+11%) grew slowest. For the national picture month by month, including the record set in July 2026, see how many homes install solar each month.
New systems keep getting bigger
The average home solar system in New Zealand is now 5.8 kW. Newer systems are larger than that: systems connected in August 2026 averaged 9.1 kW, compared with 7.5 kW in August 2025 and 4.9 kW in August 2021. Those are single-month figures, so treat them as a direction, not a precise trend.
By region, the largest average systems are on the West Coast (6.8 kW), in Taranaki (6.6 kW) and in Tasman (6.5 kW). Gisborne’s are the smallest, at 4.7 kW. Together, New Zealand’s home systems add up to 488 MW of solar capacity.
A bigger system is only worth it if you will use the extra power or be paid enough for exporting it. Size yours from your own daytime power use with our system sizing guide, and check what exports earn in our buy-back rates guide.
Where Canterbury sits
Canterbury ranks 7th of 16 on share, with 5.1% of homes. On numbers it is second only to Auckland, with 14,661 solar homes, and it added more in the past year than any other region.
Uptake inside Canterbury is uneven. North Canterbury, on MainPower’s network, ranks third of the 38 local areas at 8.4%. Ashburton is 14th (5.2%), Central Canterbury on Orion’s network is 18th (4.7%) and South Canterbury is 19th (4.2%).
Our Canterbury solar statistics page has the ten-year trend, new system sizes and battery numbers for each of the four lines companies. To see what a system would produce where you live, use our solar output figures for Christchurch and Canterbury towns.
What this means if you are thinking about solar
- A low local share does not mean solar is a poor idea where you live. What matters is your roof, your daytime power use and your price. Start with our solar cost guide.
- In a high-uptake area, ask about the export limit early. Each lines company sets how much power a home can send back to the grid, and some local lines fill up as more homes add solar. In Canterbury, our lines company table and Orion export limits guide explain the rules.
- Compare at least two quotes. Prices and system designs vary between installers. Check each quote against our list of common quote mistakes.
Common questions
How many homes in New Zealand have solar panels?
84,091 homes had solar at 31 August 2026, according to Electricity Authority data. That is 4.2% of all home electricity connections, or about 1 in 24.
Which region of New Zealand has the most solar?
It depends how you count. Tasman has the highest share of homes with solar, at 9.4%. Auckland has the largest number of solar homes, at 15,586, followed by Canterbury with 14,661.
Which region has the least solar?
The West Coast has the lowest share, at 2.0% of homes, and the fewest solar homes, at 322. It is also the fastest growing: the number rose 50% in a year.
How fast is home solar growing in New Zealand?
The number of solar homes rose by 13,051, or 18%, in the 12 months to August 2026. It is 2.6 times the August 2021 figure of 32,170.
Do these figures include businesses and farms?
No. They cover residential connections only. The Electricity Authority reports business and industrial connections separately.
Use this data
You are welcome to use these figures, tables and charts in news stories, reports, newsletters and websites. Please credit “NZ Solar, from Electricity Authority data” and link to this page so readers can see the method.
- Download the data (CSV): every region and local network area for August 2026 and August 2025, and regions for August 2021.
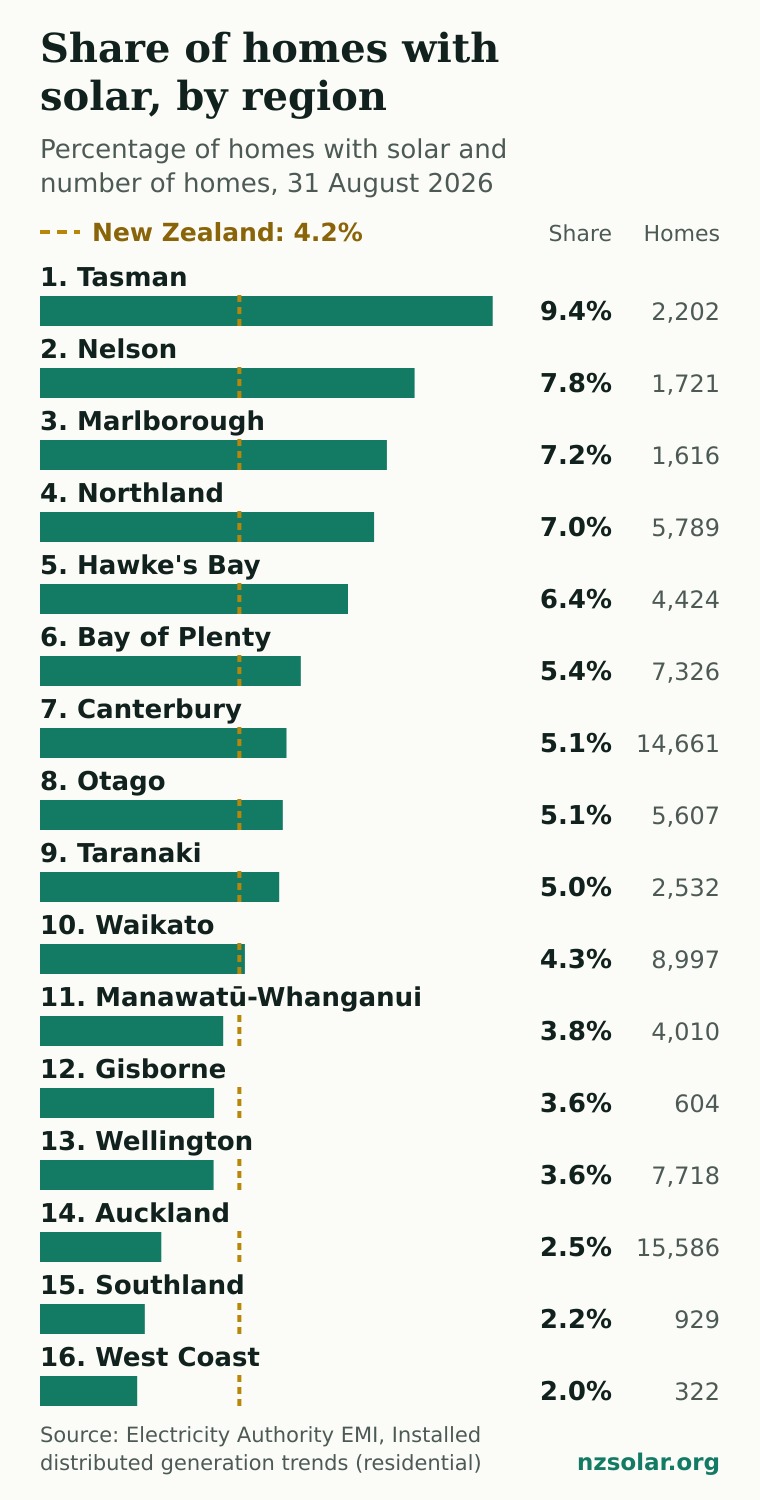
- Regional ranking chart, wide and tall version for phones.
If you need a figure that is not here, such as a single month or a longer history for one area, contact us.
Method and data
All figures come from the Electricity Authority’s Electricity Market Information (EMI) report Installed distributed generation trends, filtered to the residential market segment and solar (with and without a battery). The data is for 31 August 2026, 31 August 2025 and 31 August 2021, and was extracted on 7 October 2026.
“Homes” means residential electricity connections (ICPs) in the national registry. A connection is usually one house, flat or holiday home. Share of homes is EMI’s uptake rate: connections with solar as a percentage of all active residential connections in that area. Regions are EMI’s regional council areas. Local network areas are EMI’s network reporting regions. System sizes are the installed generation capacity recorded in the registry.
We ranked the areas, and worked out the changes between years and the number of homes added from EMI’s figures. The Auckland share of all homes is derived from each area’s count and uptake rate. The 2025 figure for Nelson and Tasman combines two areas that have since merged. “Homes added” is the change in the number of homes with solar over the year. It is a little lower than the number of new installations, because the registry is also corrected. No figure is estimated.
Some totals differ slightly. The 16 regions add to 84,044 and the 38 network areas to 83,755, because a small number of connections are not assigned to an area. Network areas group homes by location, so their totals can differ a little from the lines-company totals on our Canterbury page. The Electricity Authority also revises recent months as registry records are corrected, so later extracts can differ by a few homes.
Canterbury solar quotes
See what solar would cost on your roof.
One short request, passed to installers who work in your area. Free, with no obligation.
Get my free quotes