
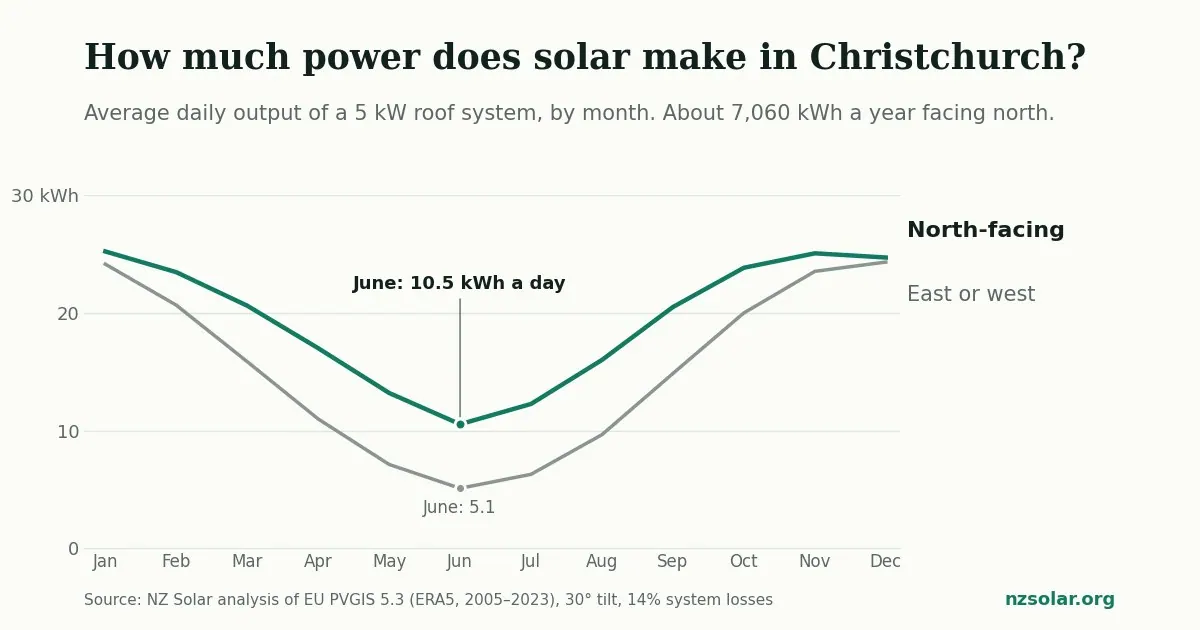
Christchurch solar output, month by month
Solar in Christchurch is strongly seasonal. From October to February a 5 kW north-facing system averages more than 23 kWh a day. In June it averages 10.5. The three winter months produce only 17% of the yearly total.
Modelled with PVGIS 5.3, 30° tilt, 14% system losses. Actual output varies with the weather from year to year.
| Month | North-facing, kWh | North, kWh a day | East or west, kWh a day |
|---|---|---|---|
| January | 782 | 25.2 | 24.1 |
| February | 657 | 23.5 | 20.7 |
| March | 639 | 20.6 | 15.9 |
| April | 510 | 17.0 | 11.0 |
| May | 409 | 13.2 | 7.1 |
| June | 316 | 10.5 | 5.1 |
| July | 380 | 12.3 | 6.3 |
| August | 496 | 16.0 | 9.6 |
| September | 615 | 20.5 | 14.8 |
| October | 739 | 23.8 | 20.0 |
| November | 752 | 25.1 | 23.5 |
| December | 766 | 24.7 | 24.3 |
| Year | 7,061 | 19.3 | 15.2 |
Across Canterbury: your town matters less than you think
We ran the same 5 kW north-facing system for seven towns. The spread is small: Kaikōura comes out highest at 7,220 kWh a year and Ashburton lowest at 6,810, about 6% apart. Shade on your roof or the wrong roof direction costs far more than living in Ashburton instead of Christchurch.
| Town | kWh a year | kWh per kW | June, kWh a day | vs Christchurch |
|---|---|---|---|---|
| Kaikōura | 7,222 | 1,444 | 11.4 | +2% |
| Akaroa | 7,126 | 1,425 | 9.4 | +1% |
| Rangiora | 7,083 | 1,417 | 11.0 | About the same |
| Christchurch | 7,061 | 1,412 | 10.5 | — |
| Timaru | 6,958 | 1,392 | 10.6 | −1% |
| Rolleston | 6,942 | 1,388 | 10.8 | −2% |
| Ashburton | 6,809 | 1,362 | 10.7 | −4% |
We left out the Mackenzie Basin and foothill towns such as Methven. The weather data behind this model is coarse in mountainous areas, and its results there do not match those areas’ known sunshine, so we did not trust it.
Roof direction and tilt: where the real differences are
A north-facing roof is best over a year, but the gap depends on the season. In January an east or west roof makes almost as much as a north one. In June it makes about half.
| Roof | kWh a year | vs north 30° | June, kWh a day | January, kWh a day |
|---|---|---|---|---|
| North, 30° (typical roof) | 7,061 | — | 10.5 | 25.2 |
| North, 45° (steep roof or frame) | 7,125 | +1% | 12.2 | 23.3 |
| North, 15° (low-pitch roof) | 6,619 | −6% | 8.1 | 26.1 |
| East, 30° | 5,532 | −22% | 5.3 | 23.9 |
| West, 30° | 5,549 | −21% | 4.9 | 24.4 |
| Flat (0°) | 5,809 | −18% | 5.1 | 25.8 |
Steeper panels catch more of the low winter sun. At 45°, June output rises 16% while the yearly total barely changes. On a flat roof, panels need tilting up on frames, or you lose about 18% a year and half your winter output.
What this means for your system
- Do not size solar to your winter bill. Canterbury homes use the most power in winter, when solar makes the least. A system big enough to cover July will export a lot of cheap power in January. Size it for the power you use in daylight year-round. Our sizing guide explains how.
- East and west roofs work if your summer use is spread out. They lose little in summer and spread output into the morning or evening, which can suit a household that is out in the middle of the day. Do not expect much from them in winter.
- Ask about tilt if winter output matters. If you want more from your panels in winter, for example to run a heat pump during the day, a steeper tilt helps. On a metal roof, tilt frames add cost and wind loading, so ask the installer to price and justify them.
- A battery will not fix winter. In June a 5 kW system averages 10.5 kWh a day, often less than the house uses in daylight, so there is little left over to store. Our battery guide covers when storage is worth it.
Use this to check a quote’s generation forecast
Every quote should include a yearly generation estimate. For a shade-free north-facing roof on the Canterbury plains, our model gives about 1,360 to 1,440 kWh a year per kW of panels. Other models land either side: EECA’s research modelling gives about 1,560 kWh per kW for Christchurch, using different assumptions, while some online calculators come in lower.
A forecast well above 1,560 kWh per kW for a Canterbury roof needs a good explanation. One well below 1,300 for a north-facing roof may be allowing for shade the installer saw on site. Either way, ask which model, losses and shade assumptions were used.
Method and data
We modelled a 5 kWp crystalline silicon system with the European Commission’s PVGIS 5.3 tool, using its PVGIS-ERA5 solar radiation data averaged over 2005 to 2023. Settings: roof-mounted (PVGIS’s building setting, which assumes less cooling airflow behind the panels), 14% system losses, and PVGIS’s horizon model. Each town uses a point near its centre. We ran the figures on 1 October 2026.
These are modelled long-term averages, not measurements from real systems. Real output depends on the exact roof, shade, equipment and each year’s weather. The EECA comparison uses the Christchurch base case in EECA’s solar PV data and performance appendix.
Download the data (CSV). You are welcome to use it; please credit NZ Solar and PVGIS (European Commission Joint Research Centre). For how many Canterbury homes already have solar, see our Canterbury solar statistics.
Canterbury solar quotes
Find out what your roof would make.
One short request, passed to installers who work in your area. Free, with no obligation.
Get my free quotes