
Solar uptake by Canterbury lines company
Your lines company is the network your home connects to. Canterbury has four main ones. Not sure which is yours? Our lines company table sorts it out by area.
| Network and area | Homes with solar | Share of homes | Growth in a year |
|---|---|---|---|
| MainPowerWaimakariri, Hurunui, Kaikōura | 3,130 | 8.3% | +22% |
| OrionChristchurch, Banks Peninsula, Selwyn | 9,516 | 4.7% | +24% |
| EA NetworksAshburton District | 731 | 5.2% | +27% |
| Alpine EnergyTimaru, Mackenzie, Waimate | 1,126 | 4.1% | +22% |
| Canterbury, four networks | 14,503 | 5.1% | +23% |
| New Zealand | 84,031 | 4.2% | +18% |
Share of residential electricity connections with solar. Source: Electricity Authority EMI.
Orion has the most solar homes by far, simply because it serves Christchurch. But North Canterbury stands out: one in twelve homes on MainPower’s network has solar. Canterbury as a whole accounts for about 17% of all New Zealand homes with solar.
Ten years of solar in Canterbury
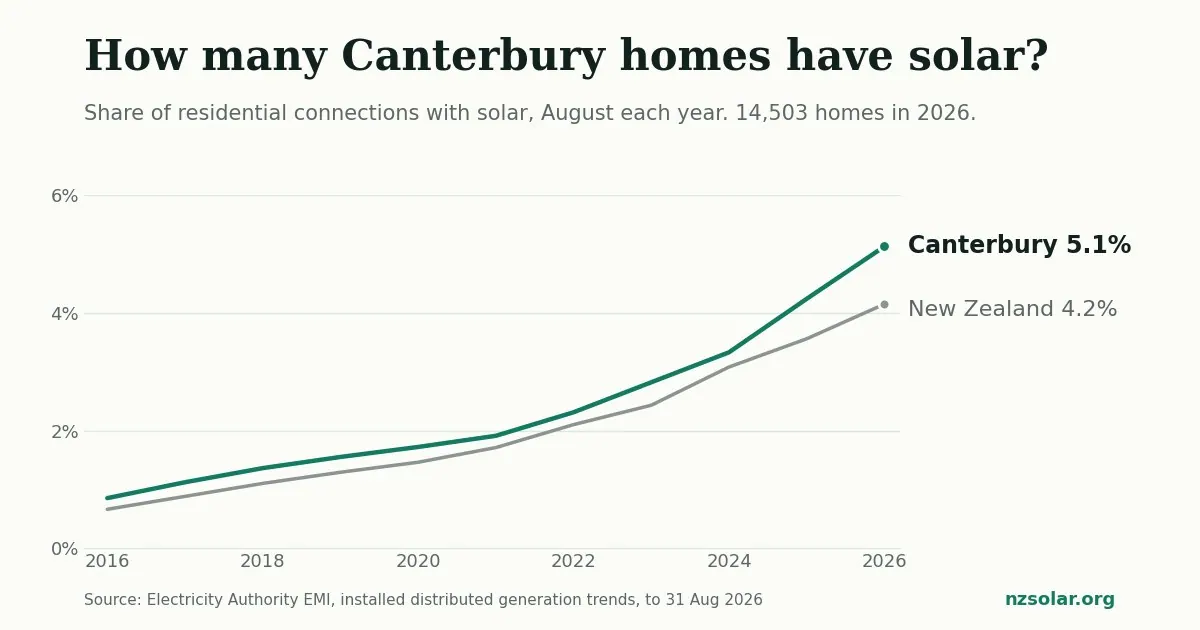
Canterbury has stayed ahead of the national average every year since 2016, and the gap has widened. The number of homes with solar has risen from 4,883 in 2021 to 14,503 in 2026, nearly three times as many in five years. Growth in the last year (+23%) outpaced New Zealand as a whole (+18%).
| Year | Homes with solar | Canterbury share | New Zealand share |
|---|---|---|---|
| 2016 | 2,032 | 0.8% | 0.7% |
| 2017 | 2,714 | 1.1% | 0.9% |
| 2018 | 3,374 | 1.4% | 1.1% |
| 2019 | 3,895 | 1.6% | 1.3% |
| 2020 | 4,289 | 1.7% | 1.5% |
| 2021 | 4,883 | 1.9% | 1.7% |
| 2022 | 6,013 | 2.3% | 2.1% |
| 2023 | 7,523 | 2.8% | 2.4% |
| 2024 | 9,058 | 3.3% | 3.1% |
| 2025 | 11,750 | 4.2% | 3.6% |
| 2026 | 14,503 | 5.1% | 4.2% |
New systems are getting bigger
The average new home system in Canterbury was 7.2 kW in the 12 months to August 2026. Five years earlier it was about 5.0 kW. EA Networks customers in Ashburton District installed the largest systems on average, at 8.5 kW.
| Network | Sept 2020 to Aug 2021 | Sept 2025 to Aug 2026 |
|---|---|---|
| MainPower | 4.8 kW | 7.8 kW |
| Orion | 5.1 kW | 6.9 kW |
| EA Networks | 5.4 kW | 8.5 kW |
| Alpine Energy | 4.6 kW | 6.7 kW |
| Canterbury | 5.0 kW | 7.2 kW |
Bigger is not automatically better. A larger system only pays off if your household uses the extra power during the day or the export price makes it worthwhile. Check any quote against our system sizing guide before you accept the industry’s new normal.
How many solar homes have a battery?
The registry recorded 2,488 Canterbury solar homes with a battery in August 2026, about 17% of solar homes. That is below the national figure of 25%. Orion’s network has the highest share in Canterbury at 21%, and Alpine Energy’s the lowest at 7%.
Battery records in the registry are recent and still catching up. MainPower’s count, for example, jumped from 3 to 358 in a year, which looks more like a change in recording than a sudden rush of batteries. Some homes with batteries are probably still recorded as solar only.
Most Canterbury solar homes still do without a battery, which matches what the numbers say about payback. Our battery or no battery guide explains when one is worth it.
What this means if you are getting quotes
- Check the export limit for your address. As more homes on a street add solar, some local networks fill up. EA Networks already lists congested areas around Lauriston, Methven, Mt Hutt and Overdale. A quote that assumes full export should say whether that is approved. See our lines company guide.
- Do not size up just because others do. The average new system is now over 7 kW. Yours should be sized from your daytime power use, not from the average.
- Compare at least two quotes. With 2,751 installs a year in Canterbury, there is plenty of competition. Use it. Our cost guide shows how to check a quote against EECA’s benchmark.
Method and data
All figures come from the Electricity Authority’s Electricity Market Information (EMI) report Installed distributed generation trends, filtered to the residential market segment, solar (with and without battery), by network participant. Data runs to 31 August 2026 and was downloaded on 1 October 2026.
“Homes” means residential electricity connections (ICPs) recorded in the national registry. Share of homes is the EMI uptake rate: connections with solar as a percentage of all residential connections on that network. Canterbury figures combine Orion, MainPower, Electricity Ashburton (EA Networks) and Alpine Energy. We worked out the combined share and the average new system sizes from EMI’s per-network figures. Network areas do not follow district boundaries exactly.
Download the data (CSV). You are welcome to use it; please credit NZ Solar and the Electricity Authority.
Canterbury solar quotes
See what solar would cost on your roof.
One short request, passed to installers who work in your area. Free, with no obligation.
Get my free quotes