
Monthly solar installs since 2013
Each bar is the number of homes that connected a new solar system to the grid in that month. The line is the average of the latest 12 months, which smooths out seasonal ups and downs.

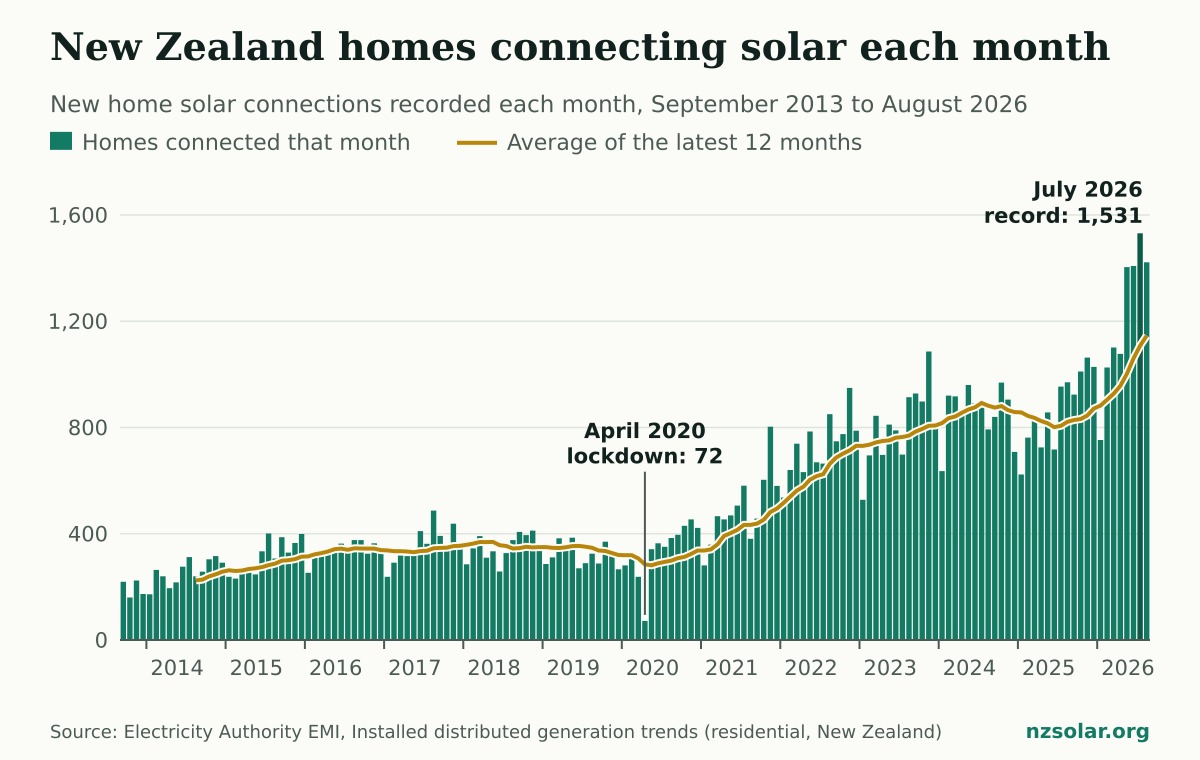
The story has three parts. From 2016 to 2020, installs were flat at about 4,000 homes a year. They then more than doubled in two years, to 8,775 in 2022. After a slower stretch in 2024 and early 2025, they took off again: the 12 months to August 2026 saw 13,748 homes connect, 39% more than the 12 months before.
The last 24 months
Every month since July 2025 has been above the same month a year earlier. From May to August 2026, 5,765 homes connected solar, compared with 3,498 in the same four months of 2025.
| Month | Homes connected | A year earlier | Change | Average size |
|---|---|---|---|---|
| August 2026 | 1,422 | 970 | +47% | 9.1 kW |
| July 2026 | 1,531 | 954 | +60% | 9.2 kW |
| June 2026 | 1,408 | 717 | +96% | 8.8 kW |
| May 2026 | 1,404 | 857 | +64% | 8.7 kW |
| April 2026 | 1,077 | 725 | +49% | 8.1 kW |
| March 2026 | 1,101 | 826 | +33% | 8.2 kW |
| February 2026 | 1,026 | 762 | +35% | 8.0 kW |
| January 2026 | 753 | 623 | +21% | 8.1 kW |
| December 2025 | 1,028 | 708 | +45% | 8.0 kW |
| November 2025 | 1,063 | 905 | +17% | 8.1 kW |
| October 2025 | 1,011 | 969 | +4% | 7.7 kW |
| September 2025 | 924 | 840 | +10% | 7.7 kW |
| August 2025 | 970 | 793 | +22% | 7.5 kW |
| July 2025 | 954 | 890 | +7% | n/a |
| June 2025 | 717 | 891 | -20% | 7.7 kW |
| May 2025 | 857 | 960 | -11% | 7.4 kW |
| April 2025 | 725 | 865 | -16% | 7.2 kW |
| March 2025 | 826 | 917 | -10% | 7.4 kW |
| February 2025 | 762 | 920 | -17% | 7.3 kW |
| January 2025 | 623 | 636 | -2% | 7.7 kW |
| December 2024 | 708 | 801 | -12% | 7.7 kW |
| November 2024 | 905 | 1,086 | -17% | 7.1 kW |
| October 2024 | 969 | 898 | +8% | 7.0 kW |
| September 2024 | 840 | 928 | -9% | 6.7 kW |
Recent months can be revised as the electricity registry is corrected. The average system size for July 2025 is wrong in the source data and is left out.
The step up in May 2026 came in the same month that new national rules required lines companies to offer a default export limit of 10 kW for standard home systems, as the Electricity Authority announced in April. The data shows the timing. It cannot show whether the rule change caused the rise.
Solar installs year by year
Calendar-year totals show the scale of the change. More homes connected solar in the first eight months of 2026 than in 2019 and 2020 combined.
| Year | Homes connected | Average size | Total at end | Share of homes |
|---|---|---|---|---|
| 2014 | 3,084 | 3.6 kW | 5,180 | 0.3% |
| 2015 | 3,763 | 3.5 kW | 8,973 | 0.5% |
| 2016 | 4,062 | 3.3 kW | 13,029 | 0.7% |
| 2017 | 4,254 | 3.3 kW | 17,280 | 1.0% |
| 2018 | 4,198 | 4.2 kW | 21,476 | 1.2% |
| 2019 | 3,838 | 4.5 kW | 25,029 | 1.4% |
| 2020 | 4,044 | 4.9 kW | 28,718 | 1.5% |
| 2021 | 5,940 | 5.2 kW | 34,589 | 1.8% |
| 2022 | 8,775 | 5.7 kW | 43,210 | 2.3% |
| 2023 | 9,689 | 5.7 kW | 52,946 | 2.7% |
| 2024 | 10,294 | 6.4 kW | 64,029 | 3.2% |
| 2025 | 10,460 | 7.6 kW | 74,848 | 3.7% |
| 2026 (January to August) | 9,722 | 8.6 kW | 84,091 | 4.2% |
System sizes have grown alongside the numbers. The average new system was 3.6 kW in 2014, 5.2 kW in 2021 and 8.6 kW in 2026. A bigger system is only worth it if you will use the power or be paid enough for exporting it, so size yours from your own daytime use with our system sizing guide.
Records and low points
- Record month: July 2026, with 1,531 homes. August 2026 (1,422), June 2026 (1,408) and May 2026 (1,404) are second, third and fourth.
- First month above 1,000: November 2023, with 1,086. The registry was being reclassified that month, so treat that figure with some caution. The next did not come until October 2025. Since then, every month except January 2026 has been above 1,000.
- First month above 500: June 2021, with 506.
- Lowest month since 2015: April 2020, with 72. New Zealand spent most of that month in its first COVID-19 lockdown.
Busy and quiet months
January is the quiet month. It had the fewest installs of any month in 8 of the 12 years from 2014 to 2025, which fits the summer holiday period. November is the busiest on average, with about 10% of a year’s installs, against 6% in January.
The swing between months is modest next to the long-term rise, so the season is a poor guide to when to buy. If you are weighing up whether to hold off for a possible subsidy, our guide to waiting for a solar subsidy after the 2026 election puts a dollar figure on each month of delay.
What this means if you are thinking about solar
- You are not early any more. About 1 in 24 New Zealand homes now has solar, and far more in some places. See how your area compares in our ranking of every region.
- Ask each installer when they can actually install. Installs are running about 50% above last year, so get a start date in writing along with the price.
- Do not copy the average system size. The 8.6 kW average reflects other people’s roofs and power bills. Check a quote against our solar cost guide and our list of common quote mistakes.
- Check your export limit before you size up. The 10 kW default does not apply at every address. In Canterbury, our lines company table shows what each network allows.
Common questions
How many solar systems are installed in New Zealand each month?
Between 1,400 and 1,550 homes a month connected solar from May to August 2026, according to Electricity Authority data. The average over the 12 months to August 2026 was 1,146 a month.
What was the record month for home solar installs in New Zealand?
July 2026, when 1,531 homes connected solar. May, June and August 2026 are the next three highest.
How many homes installed solar in 2025?
10,460 homes connected solar in 2025, slightly more than the 10,294 in 2024.
Is home solar growing faster in 2026?
Yes. 9,722 homes connected solar from January to August 2026, 51% more than the 6,434 in the same months of 2025.
Do these figures include businesses and solar farms?
No. They cover residential connections only. The Electricity Authority reports business and industrial connections separately.
Use this data
You are welcome to use these figures, tables and charts in news stories, reports, newsletters and websites. Please credit “NZ Solar, from Electricity Authority data” and link to this page so readers can see the method.
- Download the data (CSV): every month from August 2013 to August 2026.
- Monthly installs chart, wide and tall version for phones.
For the same data split by region, see our regional solar rankings. For Canterbury’s lines companies, see our Canterbury solar statistics. If you need a figure that is not here, contact us.
Method and data
All figures come from the Electricity Authority’s Electricity Market Information (EMI) report Installed distributed generation trends, for New Zealand as a whole, filtered to the residential market segment and solar (with and without a battery). The data covers every month from August 2013 to August 2026 and was extracted on 7 October 2026.
“Homes connected” is EMI’s count of new installations: residential electricity connections (ICPs) first recorded with solar in that month. The average new system is the average generation capacity of those installations. Yearly averages are weighted by the number of installs in each month. We added up the monthly figures to get the yearly, 12-month and year-to-date totals. No figure is estimated.
Three things to know when using the series. The first month, August 2013, includes connections made earlier, so the chart and the records here start from September 2013. The running total of homes with solar does not always rise by exactly the number of new installations, because the registry is also corrected and reclassified; it fell in March 2023 and jumped in November 2023 for that reason. And the Electricity Authority revises recent months as records are updated, so later extracts can differ slightly.
Canterbury solar quotes
See what solar would cost on your roof.
One short request, passed to installers who work in your area. Free, with no obligation.
Get my free quotes