
Sum one: what the night costs
A battery holds a fixed amount of energy, measured in kilowatt-hours (kWh). How long it lasts depends only on how fast the house draws that energy, measured in kilowatts (kW). So the first job is to find what your home uses from late afternoon until the panels are producing properly again.
In midwinter that is a long stretch. Christchurch gets just under 9 hours of daylight on the shortest day, according to sunrise-sunset.org, and the sun is low for the first and last hour of it. Plan on the house running from storage or the grid for 15 hours or more.
Do not guess this number. Ask your power company for your half-hourly meter data. Electricity Authority rules say retailers must supply the most detailed consumption data they hold, within five business days of a complete request. Add up June and July use from about 4:30pm to 9am. Look at a cold week, not the monthly average.
How long a battery lasts at a given load
Divide the battery’s usable capacity by the average load. The table does that arithmetic for three sizes that appear in EECA’s solar and battery cost examples.
| Average load | 5 kWh usable | 10 kWh usable | 20 kWh usable |
|---|---|---|---|
| 0.5 kW (fridge, standby, a few lights) | 10 hours | 20 hours | 40 hours |
| 1 kW | 5 hours | 10 hours | 20 hours |
| 1.5 kW | 3.3 hours | 6.7 hours | 13.3 hours |
| 2 kW (cooking plus heating) | 2.5 hours | 5 hours | 10 hours |
| 3 kW | 1.7 hours | 3.3 hours | 6.7 hours |
Three things shorten these times in practice:
- Usable is less than nominal. Datasheets often list both. Use the usable figure, and ask what reserve the installer will set for backup, because that energy is kept back from everyday use.
- Some energy is lost. Charging, storing and converting back to household power all lose a little. Ask for the round-trip efficiency on the quote.
- Load is not steady. The evening peak drains the battery fastest. A battery that covers 5pm to 10pm may have little left for the night and the morning showers.
Power matters too. Each battery has a maximum continuous output in kW. If the oven, kettle and heat pump together ask for more, a grid-connected home simply takes the extra from the grid. During a power cut that limit, and the circuits wired for backup, decide what keeps running. Our battery storage guide explains backup in detail.
Heat pumps set the size of the evening
In many Canterbury homes the heat pump is the biggest evening load, and on a frosty night it may run for hours. Its electricity use is its heat output divided by its efficiency, and efficiency falls as the outdoor temperature drops. That is why the Zoned Energy Rating Label shows heating capacity at both 7°C and 2°C, and gives annual energy use for a cold zone as well as an average one.
The quickest way to find your own heat pump’s draw is the meter data. Compare an evening when it ran with a mild evening when it did not; the difference in each half-hour is roughly what it uses. Multiply by the hours it usually runs. If it adds 1 kW for five hours, that is 5 kWh: half of a 10 kWh battery before cooking, lights or hot water.
Better insulation, curtains and a sensible thermostat setting shrink this number for every hour of every winter, which a bigger battery cannot do. If the house is cold and leaky, put that work ahead of extra storage.
Sum two: will June solar refill it?
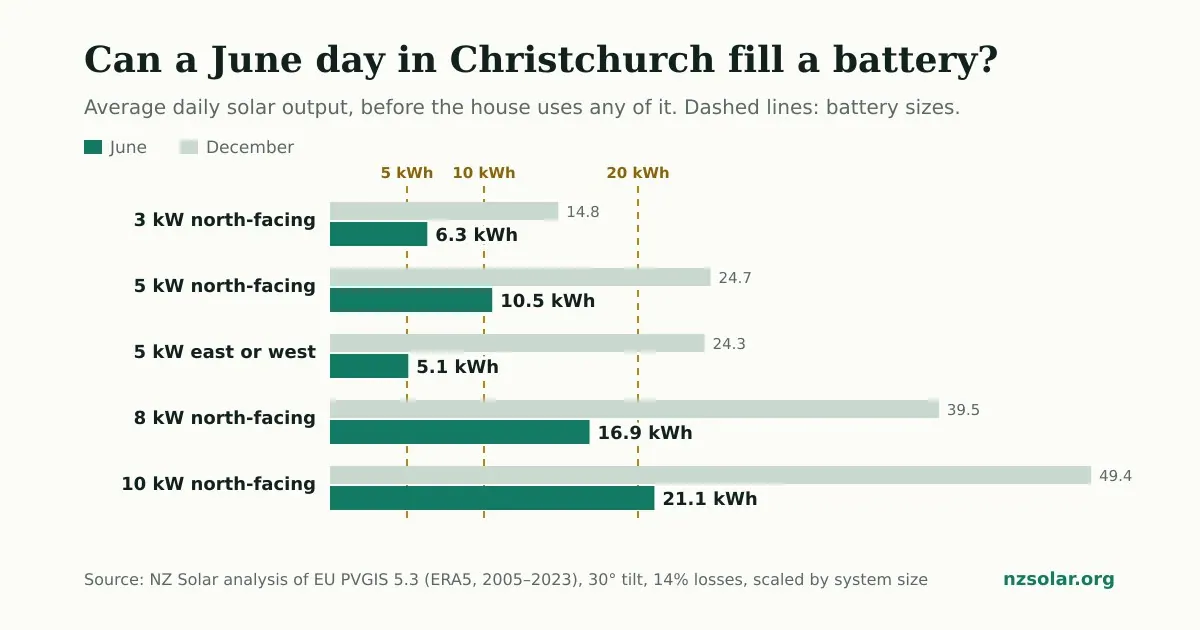
A battery only helps every night if the panels can fill it every day. Solar goes to household loads first; only the surplus charges the battery. The chart above shows average daily output in Christchurch from our PVGIS output analysis, before the house uses any of it.
| System | June | July | December |
|---|---|---|---|
| 3 kW north-facing | 6.3 kWh | 7.4 kWh | 14.8 kWh |
| 5 kW north-facing | 10.5 kWh | 12.3 kWh | 24.7 kWh |
| 5 kW east or west | 5.1 kWh | 6.3 kWh | 24.3 kWh |
| 8 kW north-facing | 16.9 kWh | 19.6 kWh | 39.5 kWh |
| 10 kW north-facing | 21.1 kWh | 24.5 kWh | 49.4 kWh |
These are long-term averages. A clear June day makes more; a run of grey days makes much less, and on those days the battery may barely charge at all.
The pattern is plain. In December a 5 kW north-facing system makes more than twice what a 10 kWh battery holds, so there is usually plenty left after daytime use. In June, a 5 kW north-facing system makes about as much in a whole average day as a 10 kWh battery holds. Once the fridge, daytime heating and hot water take their share, the battery starts the evening part full. East or west roofs fall further behind, because winter sun is low in the northern sky.
Other Canterbury towns are similar. For the same 5 kW north-facing system, Rangiora, Rolleston, Ashburton and Timaru make between 317 and 330 kWh in June, close to Christchurch’s 316; see output by town.
A worked example
This is an example to show the method, not a typical household. Suppose a family’s June meter data shows:
| Period | Average load | Energy |
|---|---|---|
| 5pm to 10pm (heat pump, cooking, lights) | 2 kW | 10 kWh |
| 10pm to 7am | 0.4 kW | 3.6 kWh |
| 7am to 9am | 1.5 kW | 3 kWh |
| Total before useful sun | 16.6 kWh |
A 20 kWh battery would cover that night on paper. But with a 5 kW north-facing system, the average June day makes 10.5 kWh in total. If daytime use takes 4 kWh, about 6.5 kWh is left to charge the battery. Most of a 20 kWh battery would sit empty for much of winter, and even a 10 kWh battery would rarely fill from solar alone.
For this household the useful winter questions are different: can the array be larger, can more use move into daylight hours, and does a time-of-use plan make overnight grid charging worth it? Grid charging only pays when the price gap covers the losses, so ask for that sum on your actual plan. In summer the same battery would fill most days, so check the year-round forecast, not just the winter one.
Buy bigger now, or add modules later?
Use the winter sum to decide. If the June surplus cannot fill the capacity you already have, another module will mostly sit unused for several months of the year. Extra storage earns its keep only where there is spare solar or a cheap overnight rate to fill it, or where you need longer outage backup.
If you start smaller, get the expansion path in writing: the exact add-on model, how many modules the system accepts, whether the inverter needs changing, and how a later module affects the warranty. Our guide to adding a battery later lists what a battery-ready design should name.
What to ask the installer
- Use my half-hourly meter data, including June and July, to size the battery.
- Show the battery’s state of charge by month: how often it fills, and how often it runs flat before morning.
- Quote usable capacity, continuous power, round-trip efficiency and the backup reserve setting.
- Include the heat pump, hot water and any EV in the evening load, not just lights and appliances.
- Compare at least two battery sizes, and solar only, on the same load profile and power plan.
EECA’s planning guide suggests a battery mainly where a household uses a lot of electricity outside daylight hours or wants backup. If you are still deciding whether to have one at all, start with battery or no battery.
Common questions
Will a 10 kWh battery run my house overnight?
Only if your evening and overnight use, after losses and reserve, fits in its usable capacity. At an average 1 kW it lasts about 10 hours; with a heat pump running in the evening it can be empty well before morning.
Does solar fill a battery in a Christchurch winter?
Sometimes. A 5 kW north-facing system averages about 10.5 kWh a day in June before household use, so on many winter days a 10 kWh battery will not fill from solar alone. A larger array or a north-facing roof helps.
Can a home battery run a heat pump?
It can supply a heat pump when the battery’s continuous power rating covers it alongside other loads. Whether it can do so for a whole evening depends on how much energy the heat pump uses on a cold night.
Should I buy a bigger battery for winter?
Not unless winter solar or a cheap overnight rate can fill it, or you need longer backup. Check the monthly state-of-charge forecast before paying for capacity that sits empty.
Method and sources
Solar output figures come from our PVGIS 5.3 analysis (PVGIS-ERA5 radiation data, 2005 to 2023, 30° roof, 14% system losses). We modelled 5 kW and scaled other sizes in proportion; real systems vary with roof, shade, equipment and weather. Monthly totals are divided by the days in the month. Download the data (CSV).
Runtime figures are simple arithmetic and the worked example is illustrative. Battery sizes follow EECA’s cost examples. Information reviewed on 2 October 2026.
Canterbury battery quotes
Get battery sizes worked out from your own data.
Tell us when your household uses power and whether backup matters. We pass that brief to installers who work in your area.
Get solar quotes